Opening Your Toolbox for Subseasonal Hurricane Forecasting
Jake Carstens is an Assistant Professor of Atmospheric Sciences at the University of North Dakota, (ironically) studying tropical cyclone physics, structure, and climatology. His teaching responsibilities include courses in atmospheric dynamics, weather forecasting, numerical weather modeling, and broadcast meteorology. He earned his B.S., M.S., and Ph.D. in Meteorology from Florida State University. Get in touch with Jake at jacob.carstens @ und.edu or Twitter/X @JakeCarstens, and head to his website for more content demystifying the tricky concepts and maps you’ll see throughout Hurricane Season!
It’s easy to feel a little anxiety about the 2024 Atlantic Hurricane Season. After all, groups like NOAA and Colorado State University issued some of their most aggressive seasonal forecasts to date. Then Hurricane Beryl made history, smashing the record for earliest Category 5 Atlantic hurricane by more than 2 weeks. Fortunately, July post-Beryl was more of a lull, as Saharan dust made the atmosphere less favorable for new storms to spin up. With that in mind, the community has dusted off its subseasonal forecasting toolbox to predict the time when business might pick up again.
First, climatology gives us A TON of useful info. For example, we know that August and September are usually when the Atlantic’s “Main Development Region” between Africa and the Caribbean is most active1. Reasons for that include less wind shear and a more active African jet stream (the “conveyor belt” that many of our hurricanes come from). But similarly to how our weather fluctuates day-to-day, and our number of hurricanes fluctuates from year-to-year, we have ebbs and flows within the heart of a Hurricane Season. We’ll discuss two of the big culprits, with legitimate potential to track them weeks into the future!
Kurt introduced one of these culprits in the Wayback Machine of 2020 – The Madden-Julian Oscillation (MJO). The other is called a “Convectively Coupled Kelvin Wave” (CCKW)2. Those names can sound scary (and the images you’ll see online might look wild at first… we’ll get to those), but we aren’t in the business of shying away here! These phenomena are still active areas of research, but let’s break down the fundamentals and how they can help tropical cyclone forecasters!
A Refresher on the MJO
Seasoned Chaos has talked about the MJO several times, as it affects our weather well outside the tropics. But, as a refresher, you can think of the MJO as a big cluster of thunderstorms moving eastward through the tropics every 1-2 months. Hurricanes need to start from some batch of disturbed weather, and, while the MJO itself isn’t the “seed” of a hurricane (that designation largely goes to the waves we see moving westward off of Africa), it can be that extra dash a seed needs to come to life. Any extra atmospheric moisture, any extra heating, any extra spin that the MJO’s storminess can provide is something that an inconspicuous blob of thunderstorms will gladly take to blossom into a tropical cyclone.
Kelvin Waves – Different, Yet Quite Similar!
Below, you’ll see a simulation I made in graduate school. Don’t worry about the labels or acronyms for now, just imagine you’re watching clouds over an imaginary blob of ocean:
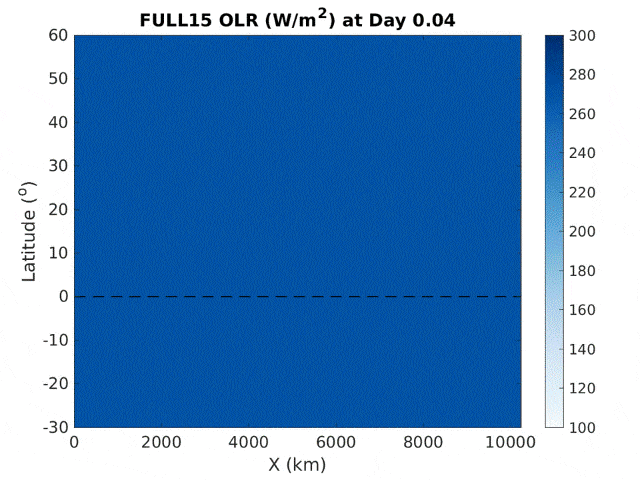
“Outgoing longwave radiation” (a proxy for cloud cover) in an idealized model simulation of the tropical atmosphere, where the sea surface temperature is the same everywhere. Used in Carstens and Wing (2023) to study behavior of organized convection, including tropical cyclones and Kelvin waves.
All those hurricanes are wild, right? But watch again, and keep an eye along the dashed line! See those packets of clouds that keep moving from west to east? Those are the Kelvin waves! Didn’t we basically just describe the MJO as an eastward-moving blob of thunderstorms? Yes! The physics behind these two types of disturbances is different, and Kelvin waves move eastward more quickly than the MJO. But their influence on storms is quite similar: Kelvin waves themselves are not necessarily the seeds for hurricanes, but they too can give that extra dash the seed needs to become a tropical cyclone.
Unlocking Our Potential
Let’s talk about the actual forecasting applications, and how far we can go with them. Because the MJO and Kelvin waves are large-scale features, they can be reasonably modeled at subseasonal time scales. Of course this isn’t perfect, but the same way that we have “ensembles” to help us break down the track and intensity of a real-time hurricane, we can get a good feel for the range of possibilities using an ensemble of models3.
How do we track the MJO and Kelvin waves, when weather is happening at all scales, all the time? In other (Seasoned Chaos-approved) words, how can we separate out one slice of the weather pattern pie? By filtering our data in time! Which brings us to this (courtesy of Dr. Mike Ventrice):
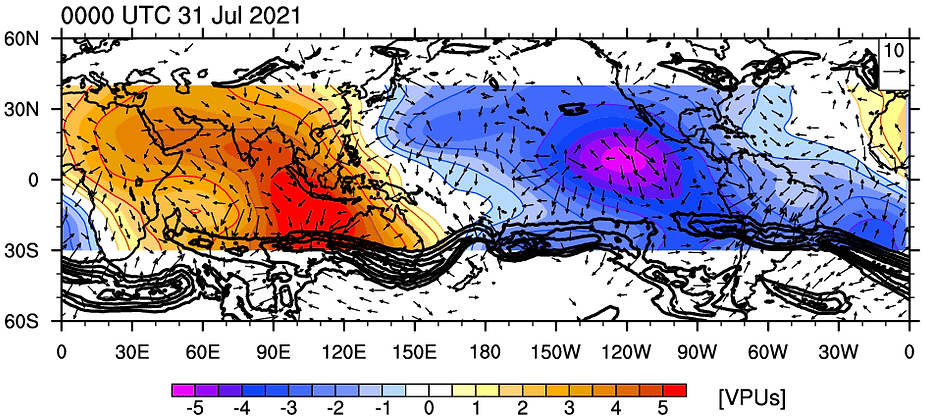
Analyzed velocity potential at the 200 hPa pressure level on July 31, 2021, courtesy of Mike Ventrice. Arrows show the “irrotational” (diverging or converging) wind, while cool shading represents upper-level divergence and vice versa. Data were filtered in time to show the eastward progression of the MJO in this case, with a strong cell of rising air (upper-level divergence) over the eastern tropical Pacific.
I saw this plot in 2021, when forecasters were concerned that August was going to be eventful (spoiler, it was). The first time I came across something like this on social media… needless to say, I was confused, and my mind went here:

But it’s not all that bad! What we’re showing here is called “Velocity Potential”, which actually answers a very simple question: Is air converging or diverging in the upper troposphere – 40,000 feet above us?
Velocity potential is a useful proxy for convection (or rising air, or thunderstorms). The GIF below breaks it down. Negative velocity potential (usually assessed at the 200 hPa pressure level) simply means air is diverging, or spreading out. This implies that air rises up from below to replace that lost mass, which is then fed by converging air in the lower atmosphere.
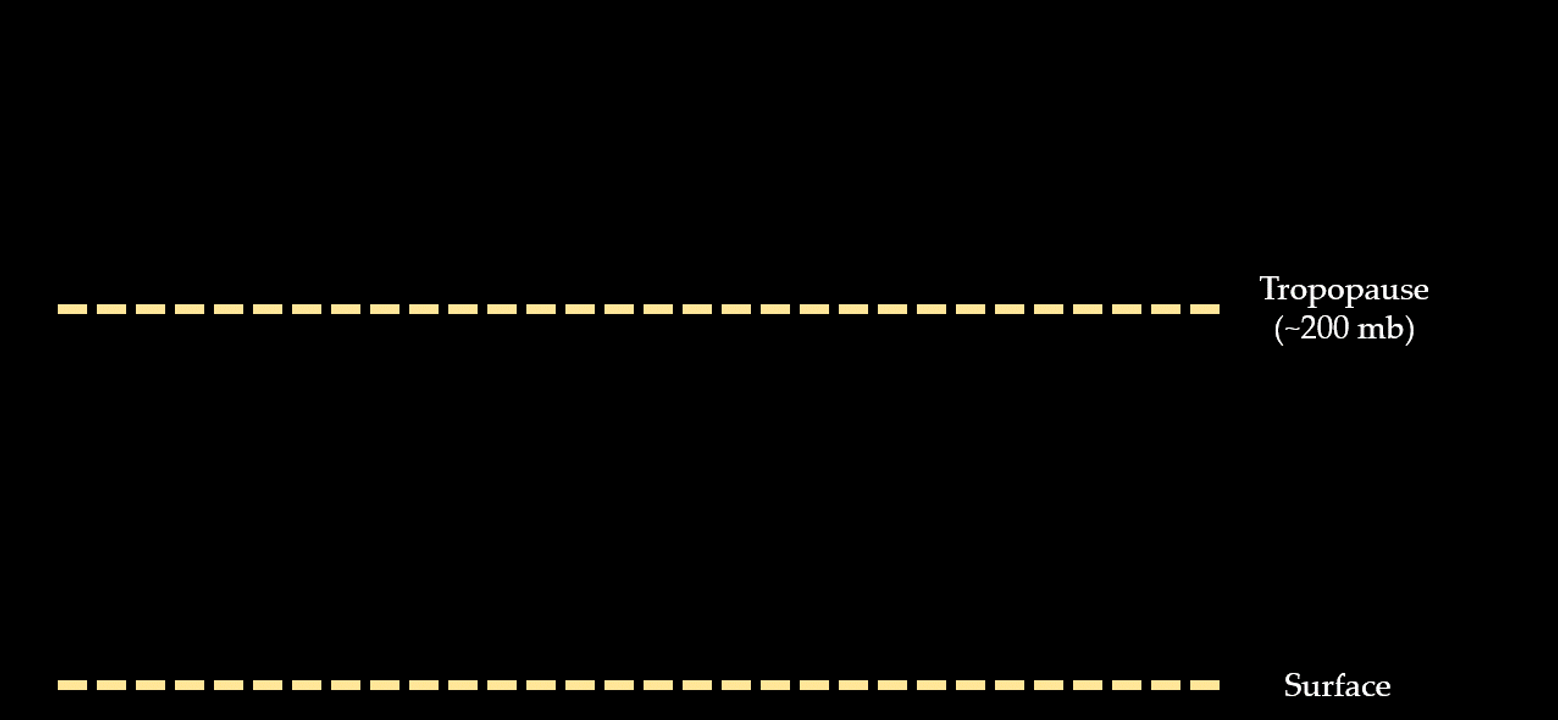
An illustration of a scenario with negative velocity potential, or upper-level diverging air.
That big blue blob in the 2021 image? That’s just a large area of anomalously active thunderstorm coverage over the Eastern Pacific, signified by negative velocity potential. In other words, air largely diverges in the upper atmosphere, replaced by rising air underneath. That blob moved east (associated largely with the MJO), added a dash to the thunderstorms already over the Atlantic and the rest was history. 7 tropical cyclones forming in the Atlantic in August 2021, including Hurricanes Grace, Henri, and Ida.
Finally, a cool way to visualize past and future movement of the MJO and Kelvin waves is via the Hovmoller diagram. Below in this example from August 2021, you see velocity potential shaded. As you move down the plot, you move forward in time, and as you move right, you move east. These streaks (dare I say… oscillations?) are these areas of disturbed weather moving eastward around the tropical atmosphere! Head here to see these in real-time, including forecasts up to 4 weeks into the future!
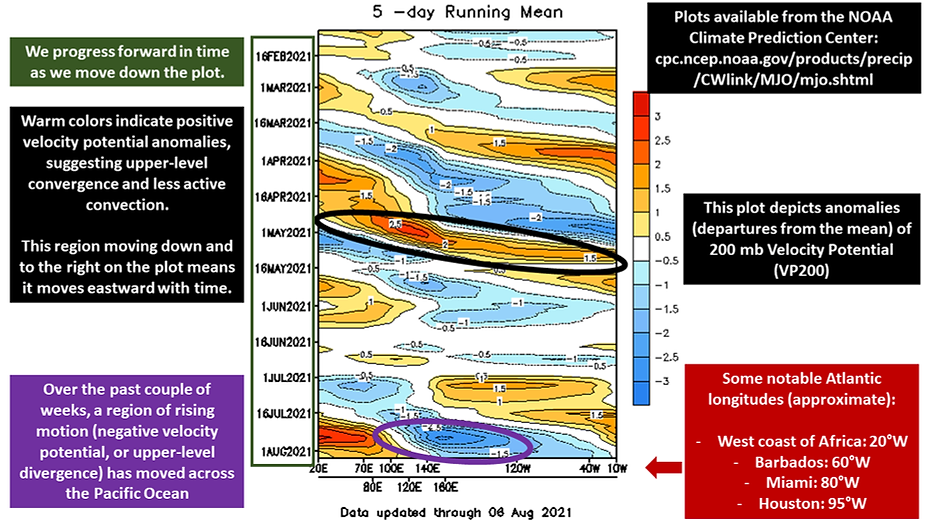
Example of a Hovmoller diagram, spanning approximately 6 months in time, showing the evolution of velocity potential throughout the global tropics. This is from the same 2021 time period as the velocity potential map above, with annotations relevant to that time period. Plot courtesy of NOAA Climate Prediction Center.
Keep this toolbox nearby as we approach the peak of the Hurricane Season! This doesn’t allow us to say things like “there will be a Category 2 hurricane in the central Atlantic in 16 days” (as much as TikTok wants to try). But it’s a great way for the forecasting community to sniff around for those handful of weeks throughout a season where we’ll want to pay a little extra attention.
Footnotes:
1See this great article by fellow Florida State grad (sorry to the Canes that run this blog…) Michael Lowry on why hurricane activity often cranks up in August.
2I’ll give a Cane a shoutout here, as recent Miami PhD graduate Quinton Lawton has done some really cool research on CCKWs!
3See this recent Seasoned Chaos article on the NMME for more about ensemble forecasting.