The More We Learn, the Less We Know: An Introduction to Chaos
The title of this post may seem awfully pessimistic – but fret not – it is actually the opposite! The beauty of science is that often the answer to a question opens up many subsequent questions. This post discusses some of what we don’t know and give insight into the intricacies of forecasting.
Predicting the future has long challenged humans searching for elements of our universe that may be predictable: the orbits of the planets and moon, tidal fluctuations, and perhaps even the weather. To make a prediction about a system, one first needs to understand how that system works (such as the physics that govern it, factors that can influence it, and so on). In recent decades, we have come to learn more of the phenomena of our climate system, like ENSO, the MJO, and atmospheric blocking, which has allowed us to better understand how the pieces of our weather pattern pie fit together.
A simple glance at the pie reveals just how complicated Earth’s climate system is. Our Seasoned Chaos blog aims to explain each of these complex atmospheric and oceanic phenomena in a similar way to how scientists research them, by isolating each slice to understand its role. But nothing is truly isolated in the climate system. Consider this through the image below. If we cut into our weather pattern pie, the ‘slices’ are actually all intertwined. Even though they operate on different spatial scales and time scales, the phenomena have multiple feedbacks on each other, interacting and contributing to our current state (slice). The more we uncover about the climate system, the more complex our understanding becomes—and thus, the more we learn, the less we know.
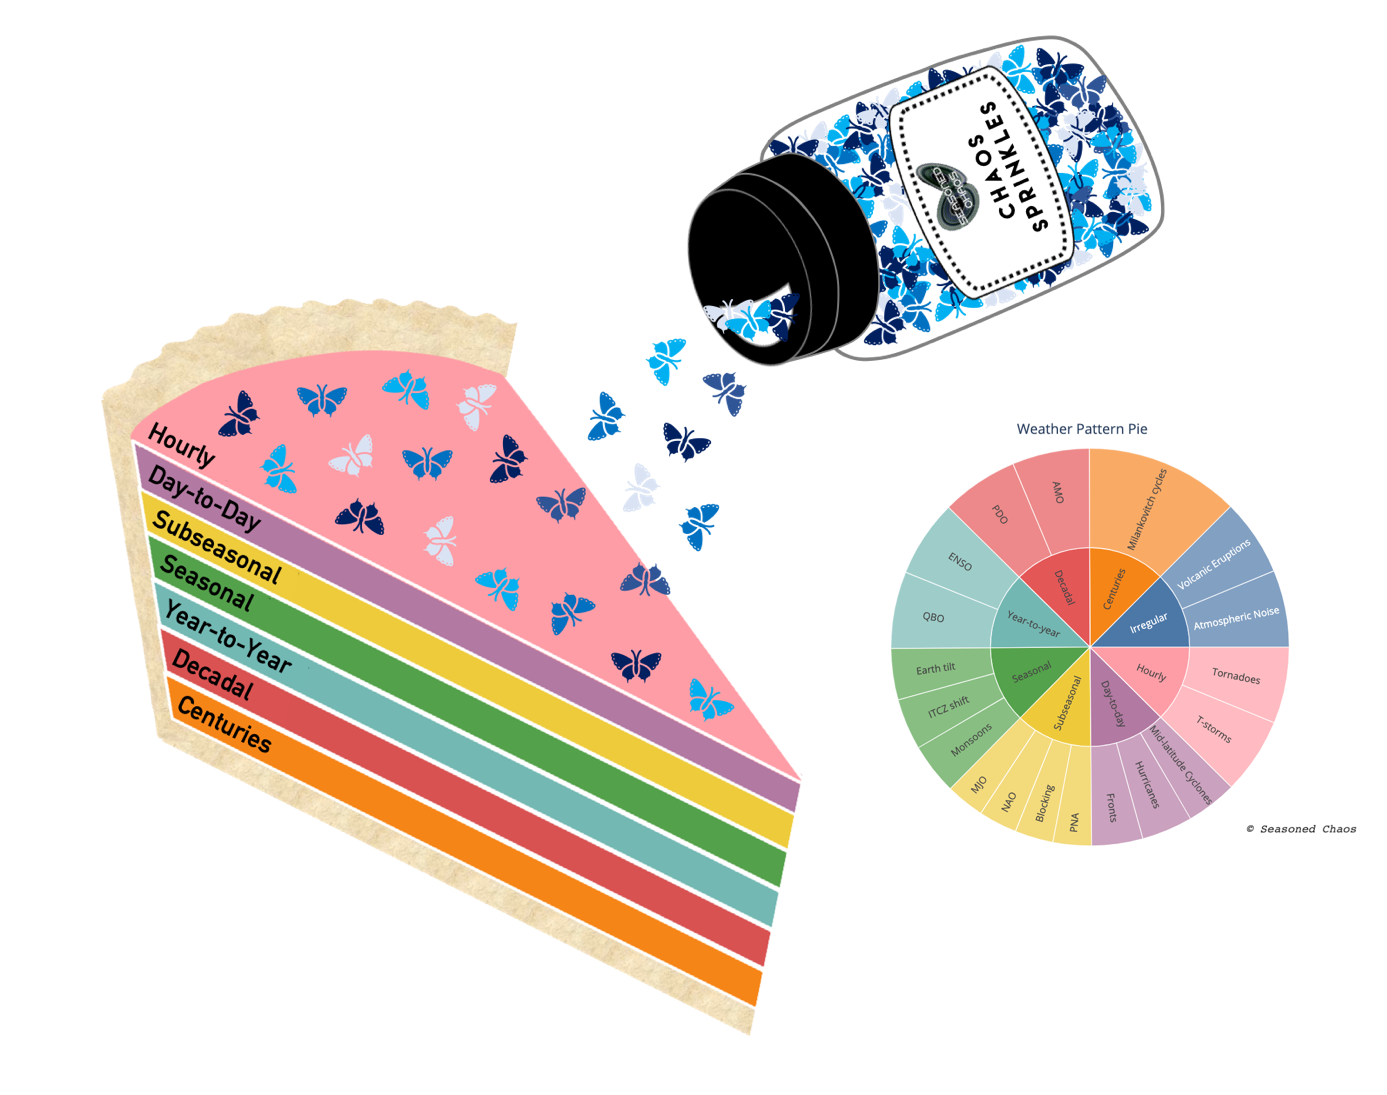
A slice of our original weather pattern pie graphic. Each slice or current state of our atmosphere depends on multiple phenomenon interacting at multiple timescales. Pie has layers. Weather has layers. You get it? They both have layers.
Why was the weather forecast wrong?
This question comes in many flavors such as “Why can’t we make better forecasts?” or “Meteorologists get paid to be wrong half the time” and is undoubtedly posed to every meteorologist. There are a few explanations behind a busted forecast, but the first is that there is an inherent amount of randomness—or chaos—in the atmosphere.
The notion of a chaotic atmosphere was devised by Dr. Edward Lorenz, with the help of Ellen Fetter, who inadvertently discovered an entire branch of meteorology. He was running computations for a weather forecast and accidentally changed the numbers in his calculations at the 1000th decimal place (.001). These seemingly inconsequential changes generated a completely different forecast! After years of research, experiments, and mathematical manipulations, it has become understood that the tiniest of perturbations can grow over time. Eventually, the errors grow too big to extract any valuable information and a forecast is no better than just a random guess.
To illustrate how the small changes in initial conditions grow over time, see the video below which shows two simulated balls marked with an X with an almost undetectable difference in their starting location. However, their paths quickly diverge, and by the end of the simulation, it is hard to imagine they started in essentially the same location. The same happens in a weather forecast. A miniscule difference for a temperature measurement, let’s say, can produce an entirely different forecast, especially 10-14 days out.
This video depicts how small changes in initial positions can lead to wildly different trajectories. The animation was produced using Python and jupyter notebooks along with basic physics. To try it out for yourself, it can be found here to download for yourself. Inspired by this @matthen2 tweet.
Why? Forecasts are made using observations at the time the forecast begins. We only have equipment to measure these variables at a finite number of weather stations, so the measurements have to be estimated for most locations. Furthermore, equipment isn’t perfect, so even the quantities taken at the weather stations have errors associated with them. Now, consider that temperature, wind, pressure, etc. quantities need to be calculated at millions of grid points to make a single weather forecast- that’s a lot of room for error. In fact, it’s actually quite remarkable that forecasts have any accuracy at all!
Does the Flap of a Butterfly’s Wings in Brazil Set Off a Tornado in Texas?
This exact question was posed by Lorenz in 1972, hinting at the idea that something as small as a butterfly flapping its wings could set off a domino chain of atmospheric events that eventually results in a tornado halfway across the world. His reaction to the question is simple: “if a single flap could lead to a tornado that would not otherwise have formed, it could equally well prevent a tornado that would otherwise have formed” (Essence of Chaos). The idea here is that the atmosphere is so sensitive and chaotic, that something as insignificant as the flapping of a butterfly’s wings could affect the weather, or as it is better known, “the butterfly effect”.
The butterfly has a second link to chaos theory. Lorenz developed a simple set of equations to model atmospheric flow, known as a Lorenz system. The system is a set of three equations to calculate a variable’s location in 3-dimensional space. The possible solutions eventually take the shape of a butterfly, with two main “wings”, or states of a variable. A depiction of two independent states of the Lorenz system taking the shape of the chaos butterfly can be seen in the video below.
This video shows the resulting ‘butterfly’ when the Lorenz equations are solved. To try it out for yourself, it can be found here to download.
The butterfly has come to be the best metaphor for a chaotic system, such as our weather. The basis of a chaotic system is that miniscule changes in the initial state create huge differences in the outcome. Chaos and uncertainty are why many forecasts are probabilistic, with tiny perturbations to the initial conditions to create a range of possible forecast outcomes.
The discovery that our atmosphere is chaotic means that our weather has a limit of predictability, or simply we cannot predict the weather past a certain amount of time. But not all hope is lost! After all, this is a blog on subseasonal forecasting beyond the predictability barrier. The more we continue to learn about how the weather pattern pie slices fit together, to understand the role of chaos in the atmosphere, and to improve our observational and modeling equipment, the more accurate predictions we can make for tomorrow, next week, and the next decade.
P.S. Does this butterfly image look familiar? Check out the Seasoned Chaos logo… some things aren’t as random as they appear after all.
A new feature being debuted in this post is our sharable Jupyter Notebooks! Both animations were crafted using Python and Project Jupyter of which we have made available for anyone to access in our public repository. Chaos and open source code for all.