Mastering Chaos: A Spooky Introduction to Data Assimilation
Bio: Senne Van Loon obtained his PhD in Physics at the University of Antwerp in 2020. In 2022, he started as a postdoctoral researcher at the Cooperative Institute for Research in the Atmosphere (CIRA) at Colorado State University. There, he performed research on data assimilation, with the goal to improve weather forecasts by relaxing the normal assumption in Bayes’ theorem.
The Earth system is chaotic (check out a refresher on chaos theory here). In theory, the flap of a butterfly’s wings could set off a tornado on the other side of the world, but could just as easily stop a tornado from forming. This makes it difficult to make predictions, and yet we are able to make decent weather forecasts, at least on the timescale of a couple of days. All of this is possible due to a meticulous combination of physical model predictions and observations, a technique called “data assimilation”.
Laplace's Demon
The French scholar Laplace devised a mystical creature, later named Laplace’s demon, an omniscient being who is able to exactly predict the past, present, and future of every atom in the universe, because they know precisely where these atoms are and how they are moving. Laplace’s demon knows where the next hurricane is going to hit, what flooding event will wreak havoc in Florida, and when the next transition to El Niño will occur. The demon has this power, because they know the exact state of the universe at the current time, and can apply the laws of physics to accurately predict what the state will be tomorrow, next month, or a century from now.
Unfortunately, the National Weather Service has no demons on the payroll, so they’ll have to make due with less. Instead, they use data assimilation to make an optimal guess of the current state of the weather, which is then used in models that forecast future weather. Data assimilation is mostly used in the bottom right slice of Seasoned Chaos’ weather pattern pie. How can we make accurate weather forecasts on the hours-to-days timescales? Of course, it is not possible to isolate this slice, as they are all interconnected, and trying to eat that slice of pie gets very messy. The chaos sprinkles on top mean even the slightest errors grow quickly. Some reasons for errors include:
- forecast models are imperfect
- approximations are used to solve the equations
- observational instruments can make errors
- observations are very sparse compared to the resolution we want
Bayes' Theorem
Knowing these limitations, what is the best approximation of the current state of the Earth system, given what the observations tell us it should be? How can we imitate Laplace’s demon as best as possible? At the root of this problem lies one of the most fundamental theorems in statistics: Bayes’ theorem. It allows us to update our knowledge of the current weather by incorporating new observations. For our math nerds out there:

The probability of being in the state X given some observations Y is proportional to the product of the probability of making the observations Y with some prior knowledge of what the state should be.
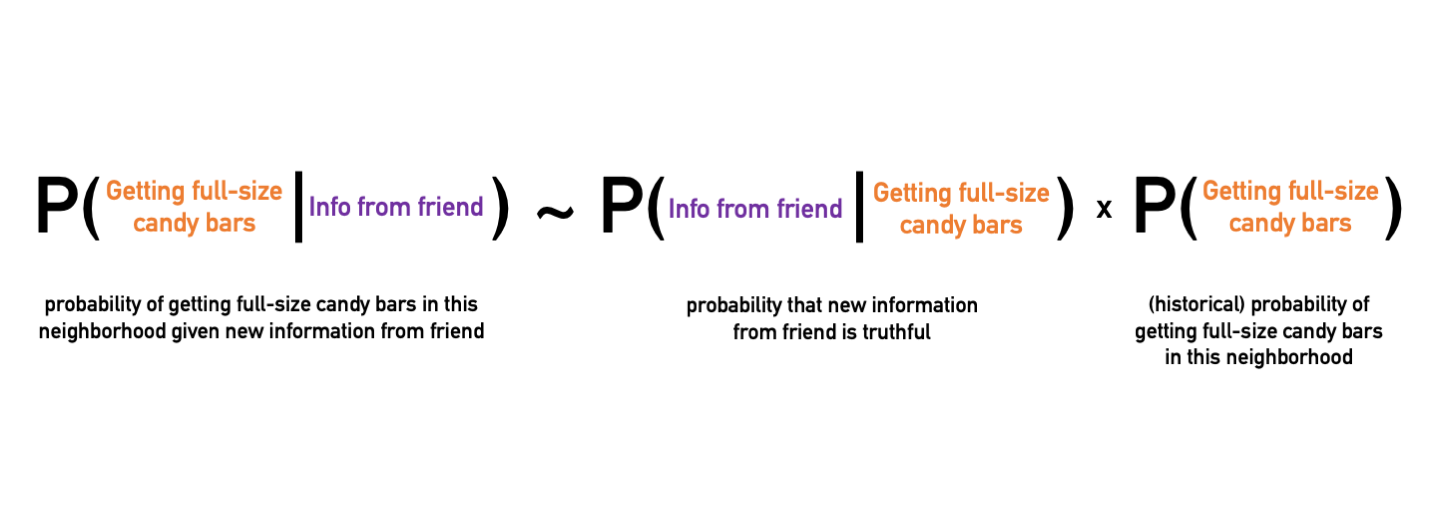
Bayes’ theorem is much more broadly applicable than just weather prediction; it offers an explicit way of calculating conditional probabilities when new information comes along. Let’s say you are deciding which neighborhood to go trick-or-treating in. You want to optimize your chances for lots and lots of sugary goodness. You know from last year that the houses on one street had full-size candy bars (your prior knowledge). However, you recently made a new friend who lives there, and they told you that the whole neighborhood decided to only give out healthy snacks this year (the observation). The observation is not the truth… maybe your friend just wants all the candy for themselves. So, you assign a likelihood to this observation: if they’re a good friend, this is a high value (close to one), and if you don’t trust them, it is low (close to zero). Then, you use Bayes’ theorem to update the probability that the street will have good candy, given what your friend said.
Instead of predicting candy bars, we’d rather want to know what the weather is like today. The left hand side of Bayes’ theorem provides the information necessary to determine the current weather: given the observations, what is the best approximation to the current state of the weather. However, we need to make another approximation: what are the underlying probability distributions on the right hand side? Turns out there is only one that we can easily work with: the normal distribution, aka the well-known “bell-curve”, widely used in many applications. Although not always optimal, it is a decent approximation to the actual distribution that only Laplace’s demon would know.
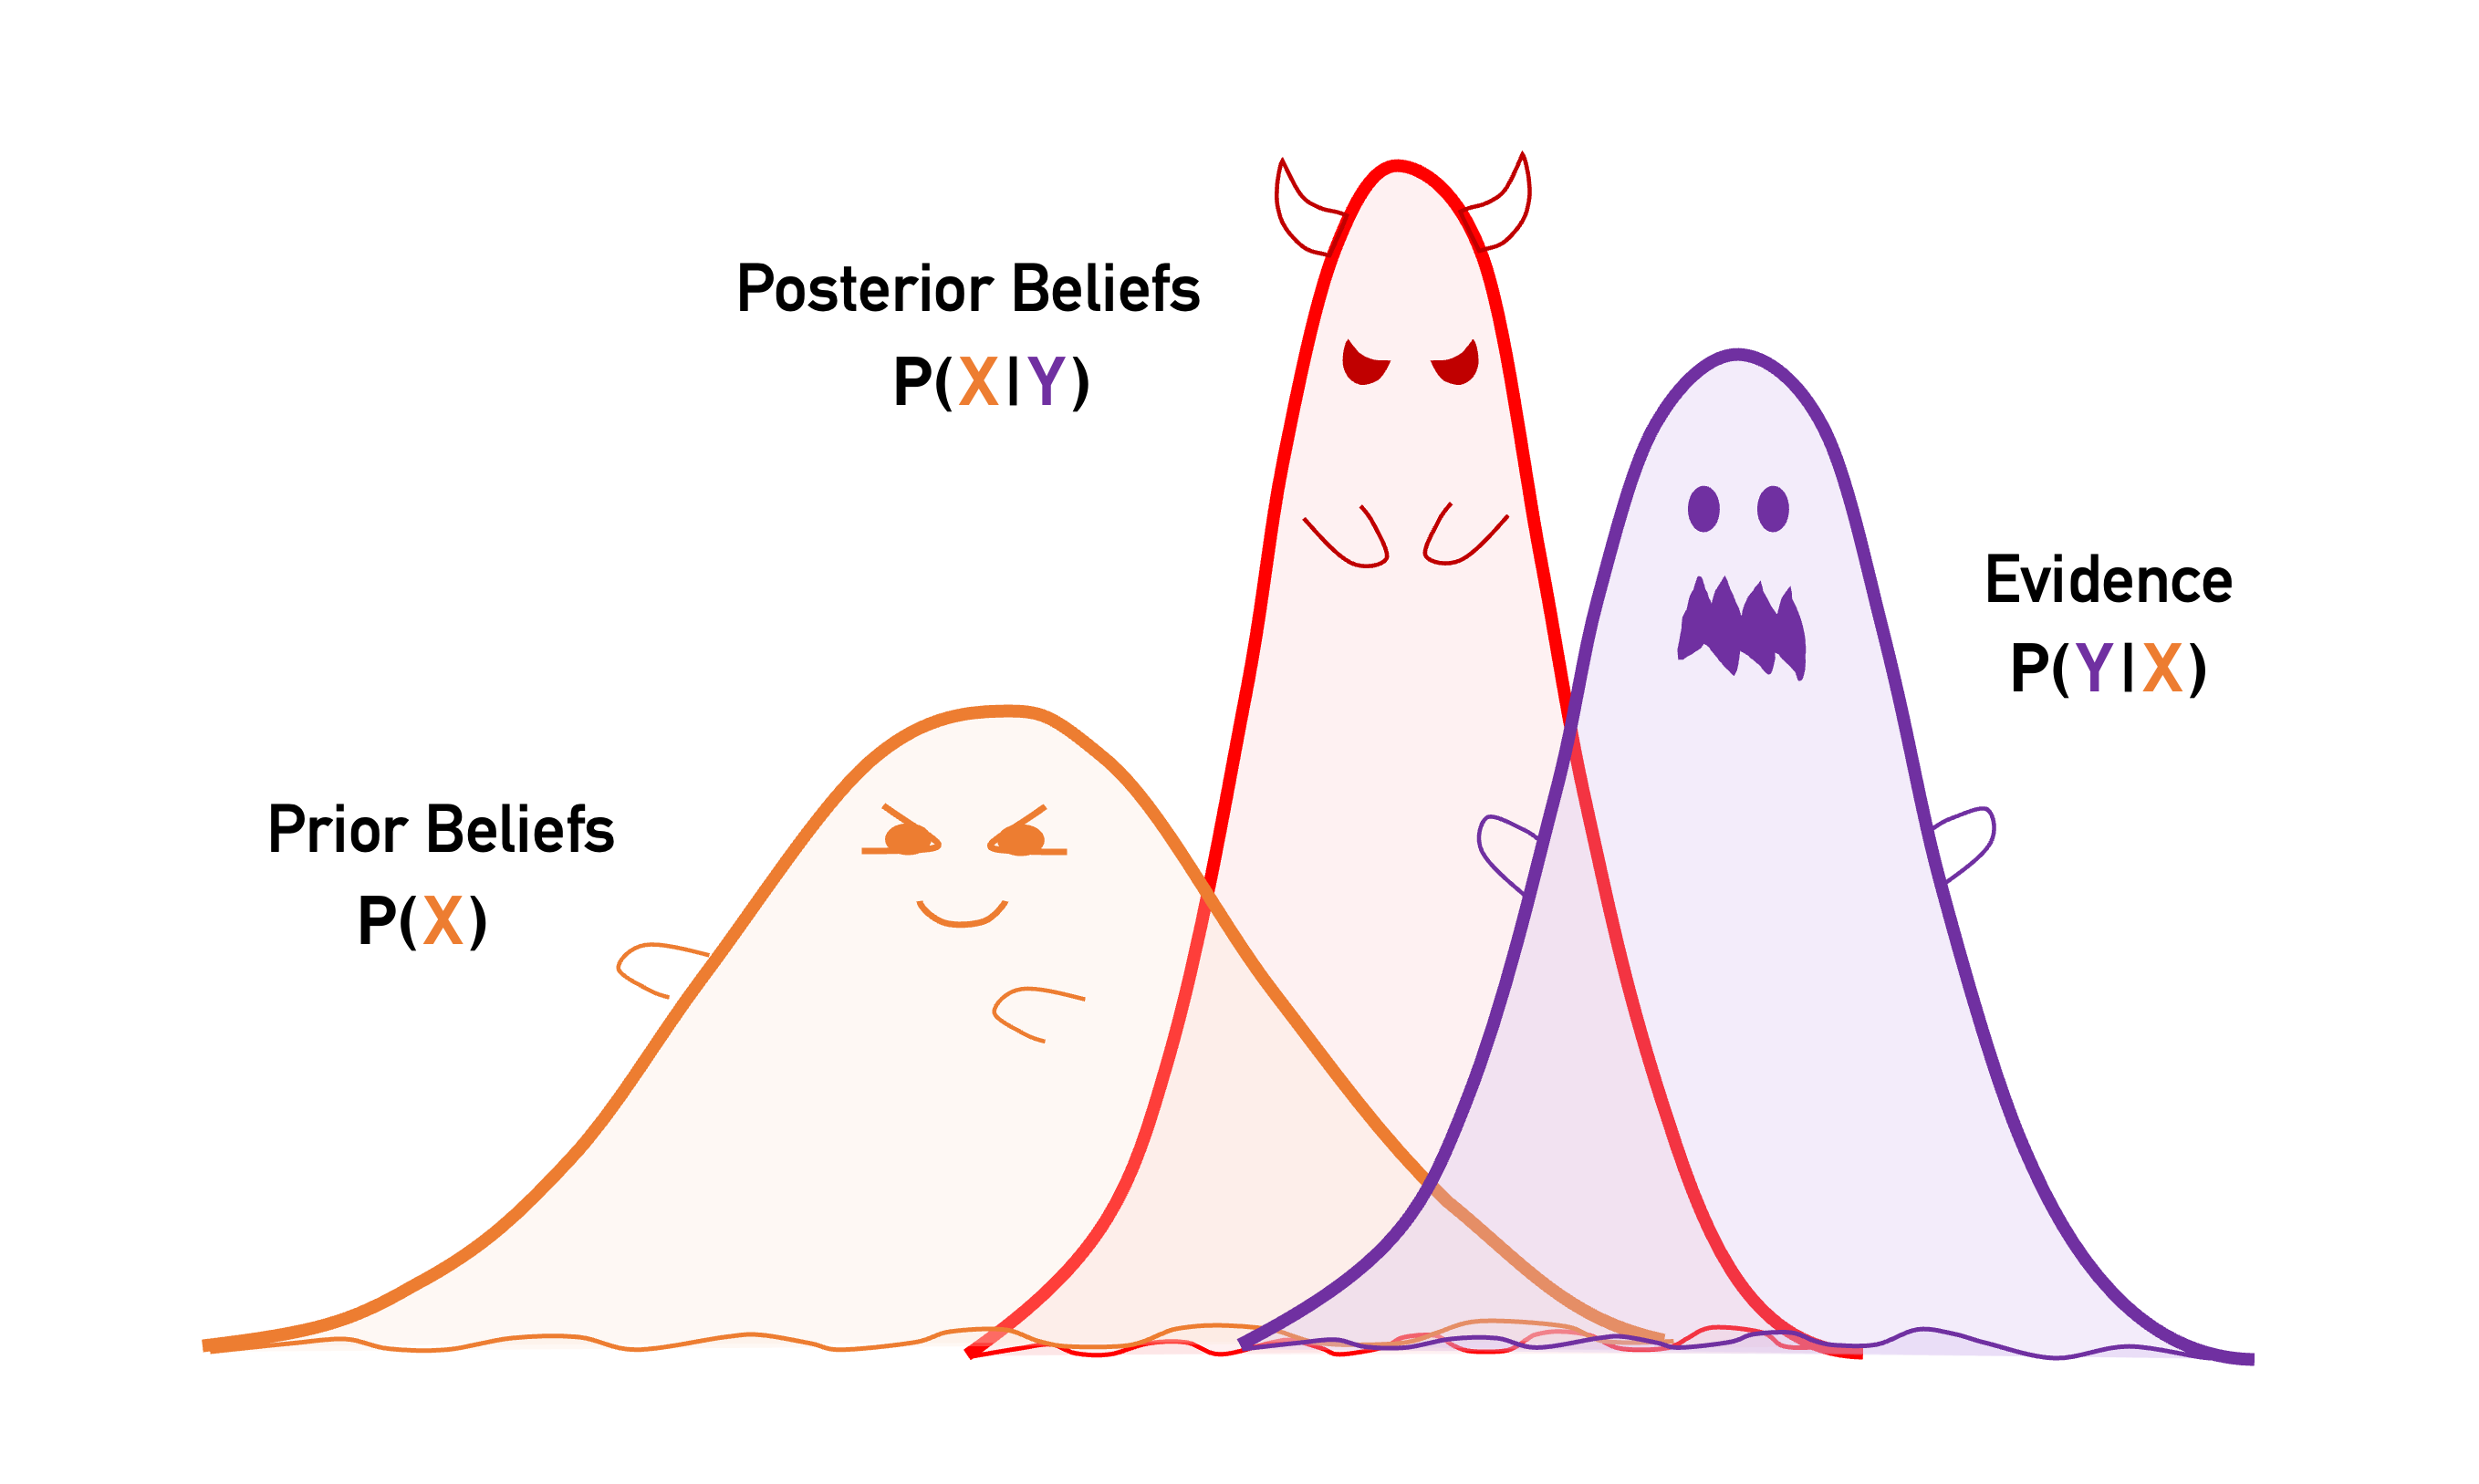
An example of Bayes’ theorem (para)normal distribution curves that represent the equations.
Minimizing the Tricks, Maximizing the Treats
But finding the most likely state of the current weather is a hard problem. Ideally, we want to know values of the temperature, pressure, humidity, etc. everywhere. Our lowly computers, however, can only feasibly handle resolutions of the order of 10km on a global scale (still a huge accomplishment!). This translates to tens of millions of grid points where we need to know the values of many different variables.
Nevertheless, using smart approximations, we can put Bayes’ theorem in a computer and let it do the work for us. Bayes’ theorem is evaluated iteratively. When a new observation comes in, we update the state (using Bayes’ theorem) and make a new, improved forecast. That forecast is then used as the prior knowledge when the next observation comes in. Bayes’ theorem tells us how to update the state for the new observation, and so on. Let’s say you decided to go to that one neighborhood despite what your so-called friend recommended (check out the GIF to see a Bayesian butterfly go trick-or-treating). You start at the first house, and you are handed an apple. You update your trick-or-treat route using Bayes’ theorem, and go to the next house. Trick or treat!, and you get a granola bar (ew!). Again, you update the probability of getting full-size candy, but go to the next house. A carrot this time. Being a good Bayesian, you finally decide to go to a different street, with the hopes of better candy.
Trick or treat! Here is a simple way to think about how Bayes theorem is used for data assimilation: the butterfly trick-or-treater has a predicted route in order to get the best candy, but she updates the route based on information she receives along the way.
Application to Weather Forecasting
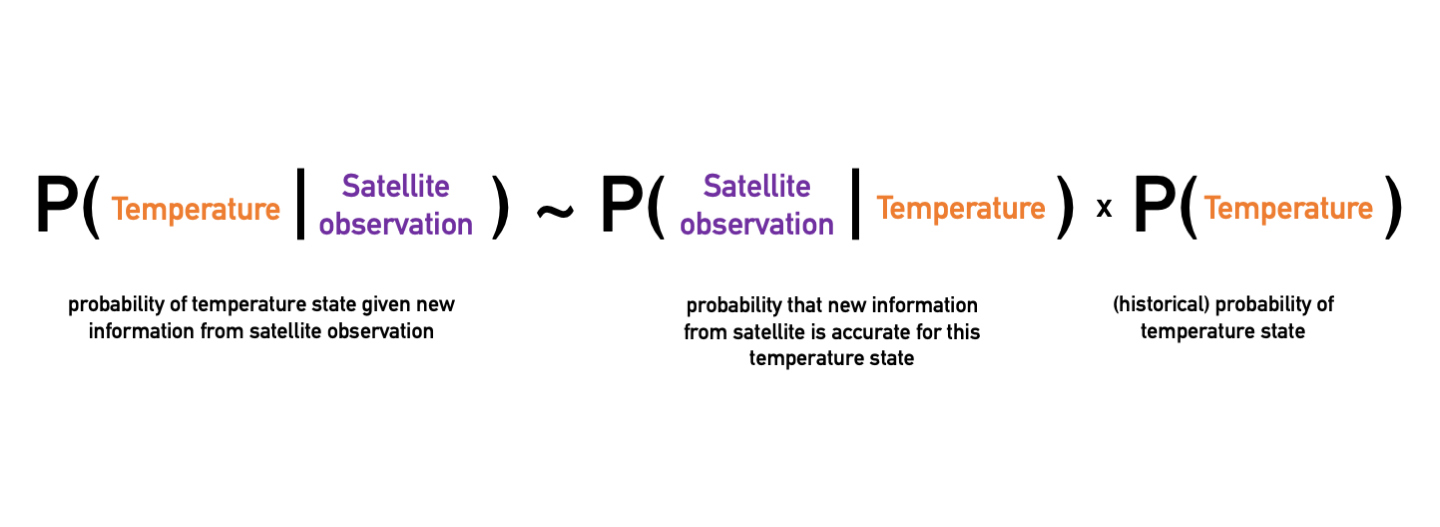
Weather forecasting works in the same way. Start with the best estimate of the current state of the weather, and use a weather model to predict the weather in six hours. Six hours later, take new observations (the more the better!) and update the current state of the system. That state is used in the weather model to forecast the next six hours, and the cycle repeats. For example, the weather model may predict that the current temperature is 25°F. However, a satellite observation just reported that it is 28°F. Unlike with our neighborhood friend, we can’t say the observational instrument is lying to us, but every measurement comes with uncertainties. Thus, we use Bayes’ theorem to update our knowledge of the current state, and estimate that the actual temperature is closer to 27°F.
If the observations were not taken into account, the model could run free and chaos would take over. Including the observations constrains the model to stay as close to the truth as possible. That is, data assimilation combines all of the information provided (observations and model predictions), to suggest a best bet of the current state. In such a way, we may stand a chance to become the masters of chaos.