Teleconnection Telenovela: Pasión of the Pacific North American Pattern
Welcome back! This episode, err—post will feature what could be one of winter’s biggest stars: the Pacific North American (PNA) pattern. Biting into another slice of our weather pattern pie, we tune into this subseasonal phenomena following the highs, lows, and other patterns of variability contributing to its arc. Will our winter forecast come to fruition? How much chaos will there be?! Find out NOW on our Teleconnection Telenovela: Pasión of the Pacific North American Pattern.
Introducing the Cast
Before we get started, some background on each supporting cast member featured in the storyline. Brush up on the returning Seasoned Chaos cast here:
- ENSO – The Safe and Stable One – The one we keep going back to, as the El Niño
Southern Oscillation (ENSO) has one of the largest influences on the atmosphere and ocean, globally, on a year-to-year basis.
- MJO – The Bad Boy – Talk about chaos. The Madden Julian Oscillation (MJO) is a subseasonal troublemaker inducing chaos as it comes and goes, propagating storminess along the equator in the Indian and Pacific Oceans with rippling consequences into the midlatitudes.
- NAO – PNA’s East Coast ‘Evil Twin’ – Ok maybe not evil, but less complex in pressure anomaly orientation and a high impact subseasonal to seasonal teleconnection pattern. The North Atlantic Oscillation (NAO) is a north-south seesaw pattern of high and low atmospheric pressure measured in the vicinity of Iceland and Portugal.
Behind the Scenes
We also need to introduce who makes everything happen behind the scenes:
- Rossby Waves – The Director – Because the atmosphere is a fluid on a rotating Earth, it has waves. The Rossby waves in the atmosphere transport energy and momentum at large scales (across latitudes, longitudes, and altitudes!) to help balance out some of the atmosphere’s temperature differences due to uneven heating from the Sun and turbulence from air moving over mountains. Their undulations of ‘highs’ and ‘lows’ (as in pressure systems) essentially set the stage/greatly influence the background state that subseasonal weather operates in.
Main Character Energy
The PNA (the protagonist of this story) is the Pacific ‘good twin’ of the NAO as they both represent subseasonal to seasonal variability in air pressure anomalies that the atmosphere ‘prefers’ to be in from time to time. They also both interact with the jet stream and have large impacts on U.S. weather. The PNA pattern is more complex than the simplified, north-south oriented dipole of the NAO. With the PNA, the primary high or low pressure anomaly is situated over the Aleutian Islands (near Alaska) with the opposite pressure near Hawai’i and over western North America as well as a pressure anomaly of same sign over the southeastern U.S. Examples of each phase of the PNA are in the figure below.
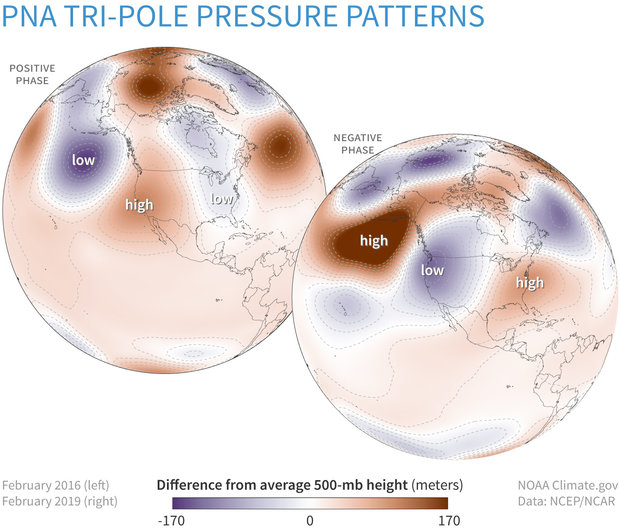
Example of pressure patterns associated with the positive and negative phases of the PNA, taken from February 2016 and February 2019, respectively. Taken from this ENSO blog post.
The PNA-MJO-ENSO Love Triangle
Here’s where the story gets spicy: the PNA, MJO, and ENSO are in a bit of a love triangle. We have hinted about the affair between ENSO and MJO in a few previous posts (ex: here, here, and here). The atmospheric waves associated with the MJO can become entangled with the atmospheric waves from ENSO. This entanglement can uniquely influence temperature and precipitation patterns over North America depending on the phase of MJO and ENSO. However, it’s complicated since the PNA is also separately involved with MJO and ENSO…
ENSO and PNA have a bit of a long-term, steady relationship such that the phase of ENSO can influence the phase of the PNA on the seasonal timescale. During El Niño, the PNA is more often in its positive phase, and, during La Niña, it is more often in its negative phase. And then MJO has more of a short-term fling with the PNA. It is hard for the PNA to resist when MJO-related convection is nearby… on the subseasonal timescale, the PNA is frequently in its positive phase when MJO-related convection (rising air) is located over the central Pacific. Overall, the PNA has ties to both the MJO and ENSO, and the consequences of their relationship just depends on the timescale.
Plot Twist
Like any plotline of your favorite soap opera/telenovela, the PNA is not always predictable. In many of our previous posts about predictability (ex: here, here, and here), we discussed how climate drivers can influence, or “force”, certain patterns. For example, warm sea surface temperatures (ENSO) and tropical convection (MJO) can force Rossby waves which direct the atmosphere into predictable patterns. But that’s not always a given. The PNA, and other teleconnections, usually fluctuate naturally, without any external influence involved, making it difficult to accurately predict its patterns and impacts in advance.
To Be Continued...
Below are some spoilers (forecasts) for the upcoming season (Dec-Jan-Feb 2023). These can be leveraged to form our best educated guess on whether the PNA will make headlines this winter. Different seasonal forecast models (NCEP, ECMWF, UKMO) seem to agree on the patterns, which resemble the negative PNA, likely because of the current La Nina conditions in the equatorial Pacific. You can also see the expected temperature patterns associated with this forecast.
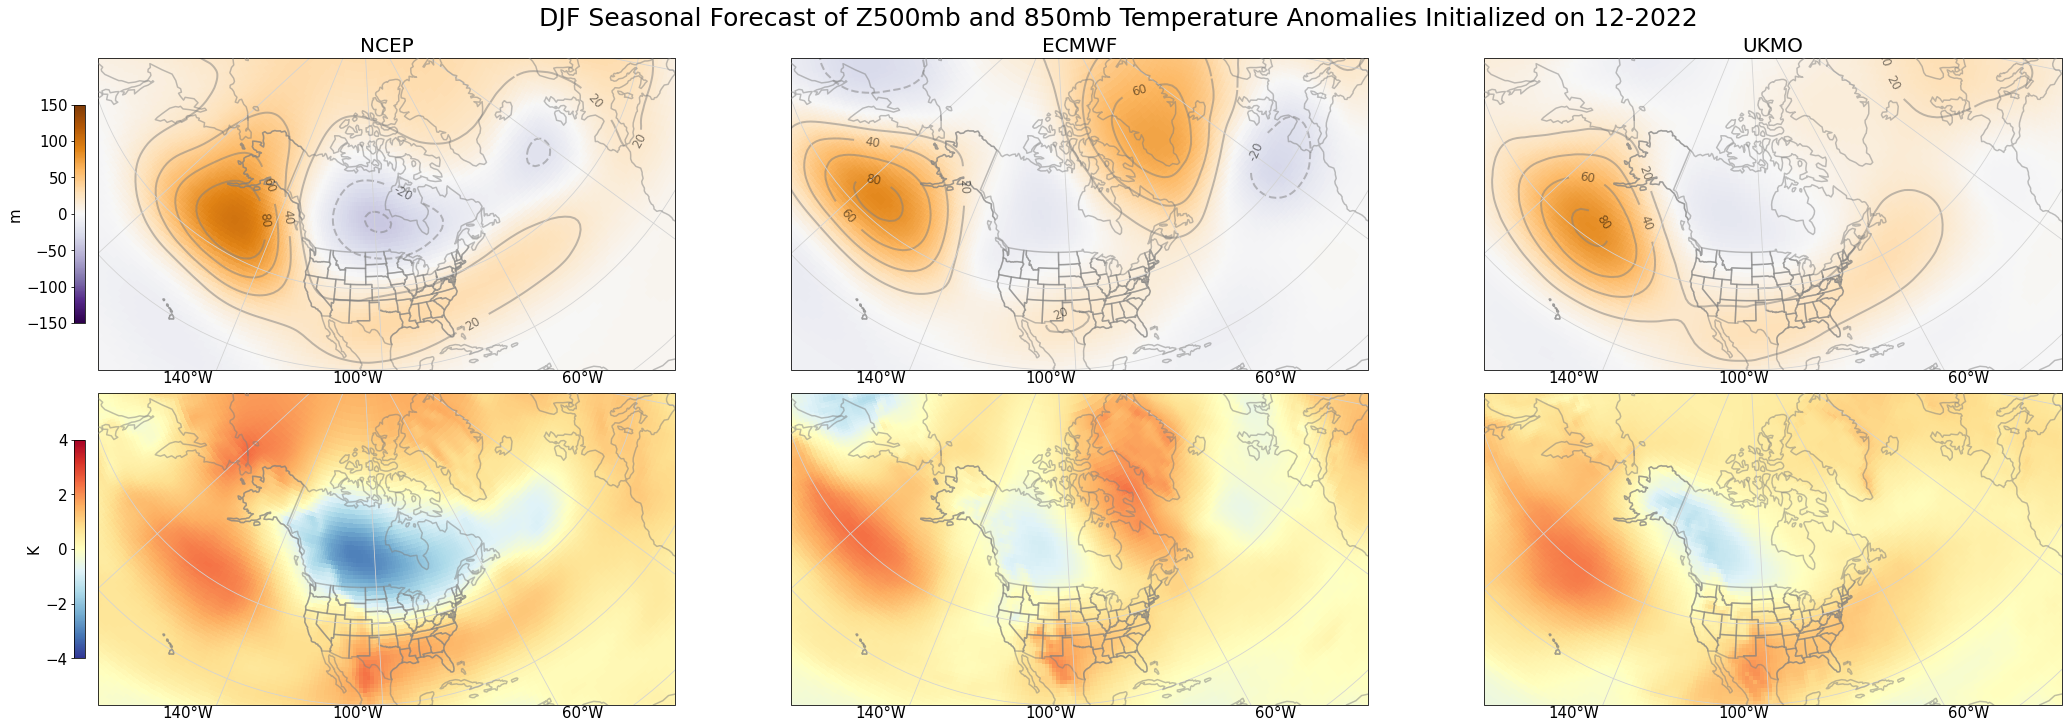
The Dec-Jan-Feb 2022-23 seasonal forecast initialized on December 1, 2022. Top row shows forecasted 500-mb geopotential height anomalies, and bottom row shows 850-mb temperature anomalies. Each column indicates a different forecast model from a different modeling center.
The known ENSO-PNA “romance” is just one way we can try to predict what’s going to happen this winter. But will the MJO come along and cause drama? Ultimately, it’s a cliffhanger, and we’re just gonna have to stay tuned until the next episode-ahem-forecast.
Want to make your own seasonal forecast plot? The code we developed to grab seasonal forecast data from the Copernicus Data Store (CDS) using multiprocessing is available in our Seasoned Chaos repository. It is an intermediate/advanced code that may require some backend magic to get working on your machine. We have provided a lot of commentary and text to help but, if it doesn’t work there are still great tidbits of code featured. #OpenSource4Life.